Topic 3 - Popular Open Source Projects for Geospatial Field
![]() Target Audience: Users
Target Audience: Users
![]() Objective: By the end of this topic, participants will be able to: (1) describe the main types of geospatial open-source projects, (2) understand what makes a project active and popular and (3) explore and compare projects using the FOSS4G Observatory platform.
Objective: By the end of this topic, participants will be able to: (1) describe the main types of geospatial open-source projects, (2) understand what makes a project active and popular and (3) explore and compare projects using the FOSS4G Observatory platform.
I. Introduction
A geospatial software is used to collect, store, query, analyze and visualize spatially referenced data. This data that contains location information, such as an address with a city, a postal code, or latitude and longitude coordinates is called geospatial data or geodata.
Open-source geospatial software covers a wide spectrum of libraries, applications and platforms developed under various Open Source Initiative (OSI) licenses. Because the geospatial field is vast and diverse, providing a complete review of all open-source solutions and their applications it would be difficult to create an exhaustive list (Coetzee et al., 2020).
However, given the extensive nature of what could be an "open source solution" for each stage of the geospatial cycle - storage, processing, visualization, open source projects can be grouped into the following categories of open source software for geospatial: core libraries, server-side, desktop, web tools and mobile (Table 1).
Table 1 -Categories of Geospatial Open-Source Software
| Category | Descripton | Example |
|---|---|---|
| Core library | standalone packaged code that provide common capabilities across the various geospatial applications, allowing applications to easily add features/functionalities that otherwise would involve a great deal of implementation | GDAL, OGR, PROJ |
| Server-side | applications build to run on a server | GeoServer, MapServer, QGIS Server |
| Desktop | applications build to run locally on a computer | QGIS, GRASS, SAGA GIS, gvSIG, uDIG |
| Web tools | applications that allow a user to access, visualise, process geospatial data on the web | Open Layers, Leaflet, MapLibre GL JS |
| Mobile | applicationsthat are build to run on mobile devices such as tablets and mobile phones | QField, Geopaparazzi |
II. Understanding Popularity and Project Activity
Open source software relies heavely on the community that builds and maintains it. The more active and diverse a community is, the more likely it is to be improved and updated, have bugs fixed more often, and provide support in forums and through documentation. But, not all open source geospatial projects evolve at tha same pace. Some of them have a large and active community that frequently contributes to developments and improvements, others, although remaining functional and valuable, are maintained by a smaller number of contributors. To make these differences visible, the FOSS4G Observatory uses a quantitative approach to describe how actively a project is being developend and maintained. The methodology to calculate the project activity is considering two parameters: (1) number of contributors and (2) count of commits, with more weight placed on contributors and recent activity within the git public repository (Ilie, 2025). Based on the results, the FOSS4G Observatory classifies projects into 6 levels of activity (Figure 1):
-
Inactive: These projects exhibit minimal recent engagement from contributors or development activity.
-
Very Low: These projects show nascent or very limited recent activity.
-
Low:These projects demonstrate a noticeable but still modest level of recent engagement.
-
Active: These projects are characterized by consistent and healthy recent activity, indicating ongoing development and community involvement.
-
Very Active: These projects exhibit a high volume of recent contributions and development, signifying robust and dynamic progress.
-
Very High:These represent the most vibrant and actively developed projects within the FOSS4G ecosystem, showcasing exceptional levels of recent engagement.
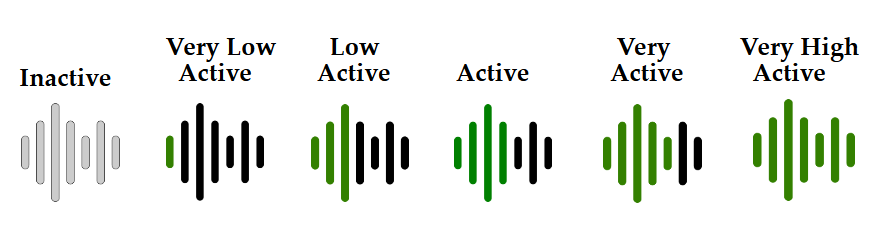
Figure 1 - Levels of the project's activity
Within the FOSS4G Observatory, other statics are also collected, such as (Ilie, 2025):
-
Number of stars - a ”star” is a form of approval and appreciation from the users or developers who find the project’s features valuable, but may not want to contribute or modify the code. It is considered that a higher number of stars can indicate a broad and supportive community.
-
Open issues - it is not a metric in itself, as it can either mean that the project has active development or a backlog if issues remain unaddressed for a long time (this metric is considered in the calculation of the activity project metric).
-
Number of watchers - a higher number of users that request notifications on any activity in the repository, without being collaborators, is a sign of interest in the project that can be considered as a proof of quality of the work ongoing.
-
Number of forks - forking involves creating a copy of the project's source code, enabling contributors to experiment with changes without impacting the original project. Thus, the number of forks can reflect the project's popularity and utility, while also serving as an indicator of a large and active community of contributors.
III. Check Popularity and Project Activity with FOSS4G Observatory
-
Access the FOSS4G Observatory
- Open the platform in your browser: https://project.oss4geo.org/
-
Search for one or two project
- Projects can be searched for by directly typing the project name in the Search by name field or by applying filters (Category, Functionality, License, Organisation) in the Search and Compare Projects window (Figure 2). You can observe some main indicators: description, keywords, functionalities, standard compliance, number of contributors, lines of codes and commits.
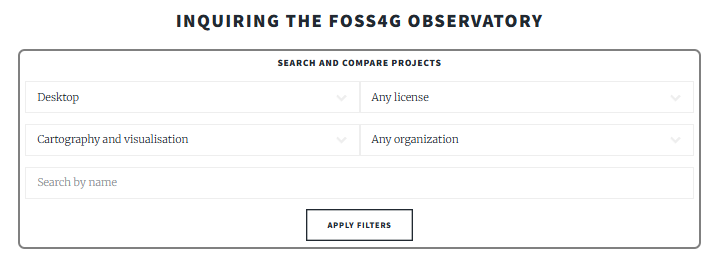
Figure 2 - Levels of the project's activity
- Explore the tables, graphs and compare two projects (Figure 3)
- Select 2 similar projects (e.g., QGIS and GRASS);
- Compare their indicators;
- Note differences and decide which project is more active, better maintained or more relevant to your needs.
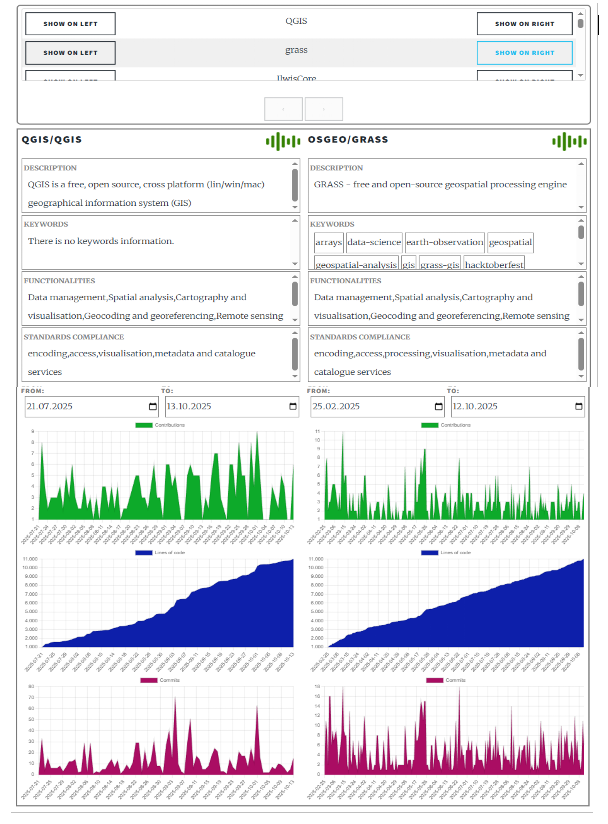
Figure 3 - Example of comparing two similar projects
IV. Discussion questions
- What are the main categories of open source geospatial software?
- How can you tell if a project is active or well maintained?
- Compare two projects from the same category (e.g., QGIS vs gvSIG or GeoServer vs MapServer)
- Which one appears more active?
- How many contributors and commits can you find?
- What factors might explain the differences?
References
-
Coetzee, S., Ivánová, I., Mitasova, H., & Brovelli, M. A. (2020). Open Geospatial Software and Data: A Review of the Current State and A Perspective into the Future. ISPRS International Journal of Geo-Information, 9(2), 90. https://doi.org/10.3390/ijgi9020090
-
Ilie, C.M. (2025), Quality metrics of open source for geospatial software quidelines, Deliverable for the Contract No. 4000140120/22/I-DT-bgh
-
FOSS4G Observatory - https://project.oss4geo.org/
-
Open Source Initiative - https://opensource.org/